
TL;DR
Here is what a proper mutual fund portfolio review actually covers:
- Excess returns over market: Did your portfolio consistently beat the benchmark, or just ride a bull run?
- Downside behavior: When markets fall, does your portfolio fall more or less than the benchmark?
- Recovery speed: After a crash, does it recover faster or slower than the market?
- Risk worth taking: Is the extra return you're getting proportionate to the extra risk you're carrying?
- Asset allocation: Your actual large, mid, small cap split. Is it right for your horizon?
- Real diversification: Do your funds own genuinely different stocks, or the same ones in different wrappers?
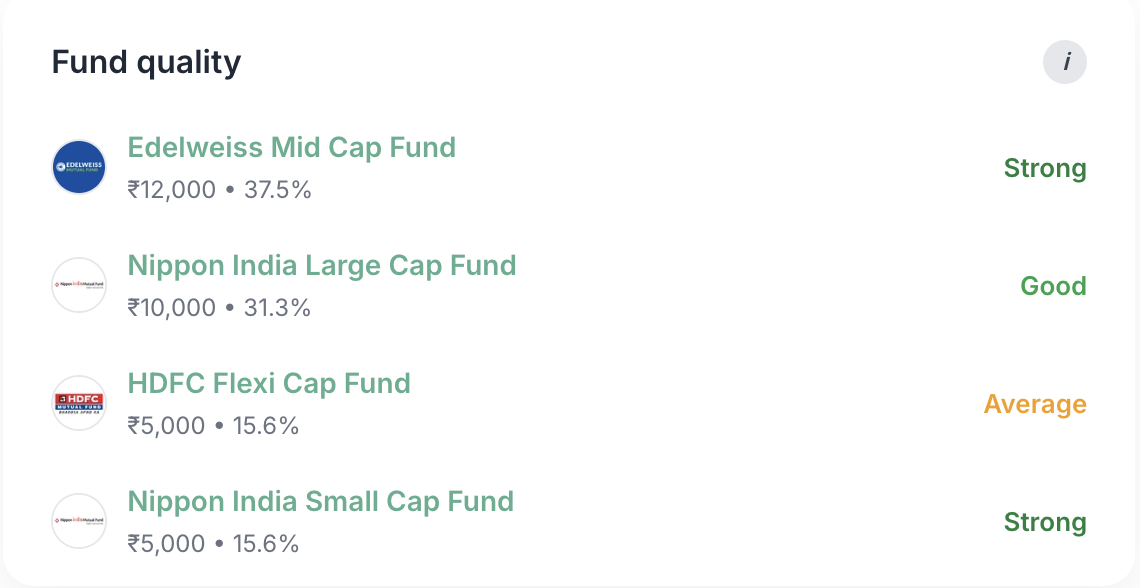
- Fund quality: Are your individual funds consistently better than their category peers?
If you cannot answer these about your portfolio, you do not fully know what you own.
Who This Is For
This mutual fund portfolio review framework is especially useful if:
- You have 3 or more mutual funds and are not sure how they fit together
- You invest via SIPs but have not reviewed your portfolio in over a year
- Your portfolio fell sharply in the 2024-2025 correction and you did not expect it to fall that much
- You copied fund recommendations from YouTube, Instagram, or social media
- You do not know your actual large, mid, small cap split across all your funds
- You are unsure whether the risk you are taking is actually worth the return
If any of these sound familiar, read on.
Review your portfolio on Dr Fin →
The Problem With Just Looking at Returns
Most investors review their mutual fund portfolio the same way: open the app, check returns, feel good or bad, close the app.
Returns only tell you what happened in good times. They say nothing about whether your portfolio is actually well built, or whether it will hold up when markets turn.
Markets have been rough. Since late 2024, mid and small cap funds have seen significant corrections. Many portfolios that looked excellent on a 3-year return chart gave back a substantial portion of those gains. Investors who understood their portfolio's downside behavior stayed calm. Those who did not were caught off guard.
A portfolio with 70% smallcap and midcap exposure may return 22% in a bull year. But it can also fall 40% in a sharp correction. Another portfolio that returned 16% annually might fall half as much and recover twice as fast. Which one is actually better for you depends entirely on your horizon, your allocation, and whether you understood what you owned.
That is the question a proper mutual fund portfolio analysis should answer.
Bad Portfolio vs Better Portfolio
Before going into each section, here is the pattern this article is really about:
| What a Problematic Portfolio Looks Like | What a Better Portfolio Looks Like |
|---|---|
| 7 or 8 funds with heavy overlap | 4 to 5 funds each doing a different job |
| 70% smallcap and midcap unknowingly | Intentional allocation that matches your horizon |
| High downside, similar return to simpler options | Better risk-adjusted return for the same or less risk |
| Chasing recent top performers | Consistent long-term quality vs benchmark |
| No idea how it behaves in a crash | Knows the historical worst-case and is prepared for it |
| Funds copied from social media | Funds evaluated on rolling performance vs category peers |
If the left column describes your portfolio, the sections below explain exactly what to fix and why.
1. Did Your Portfolio Actually Beat the Market, Consistently?
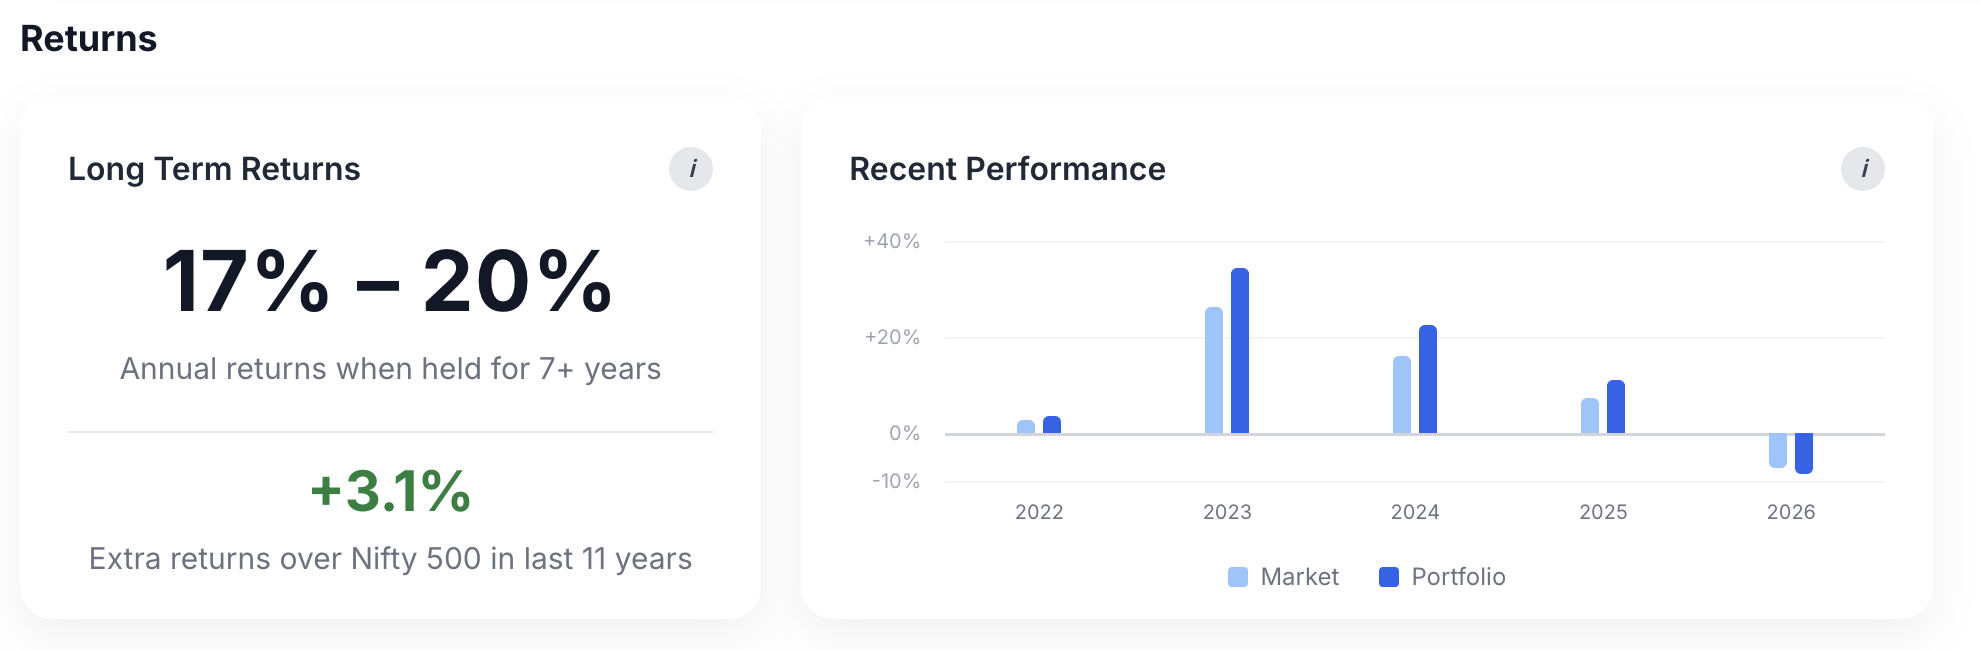
In a bull run, almost everything goes up. The real question is whether your portfolio has consistently beaten the market across good years and bad, not just recently.
Start simple. A fund returning 18% sounds impressive. But if the market returned 17% that year, the fund manager added just 1% of actual value. Strip away the market's contribution and you are left with a much smaller number. That is the number worth caring about.
Consider two portfolios over 7 years. Portfolio A returned 18% annually but underperformed the Nifty 500 in 4 of those 7 years, only beating the market during the bull stretches. Portfolio B returned 16% but beat the benchmark consistently across most rolling 3 year periods. Portfolio B is the more reliable one, even with the lower headline number.
Past absolute returns will not repeat. But a portfolio that has consistently beaten the market across different conditions is a far more reliable indicator of quality than one that had a great two-year run when everything was going up anyway.
What to look for: Excess return over benchmark across rolling 3Y and 5Y periods, not just recent performance.
2. When Markets Fall, Does Your Portfolio Fall More or Less?
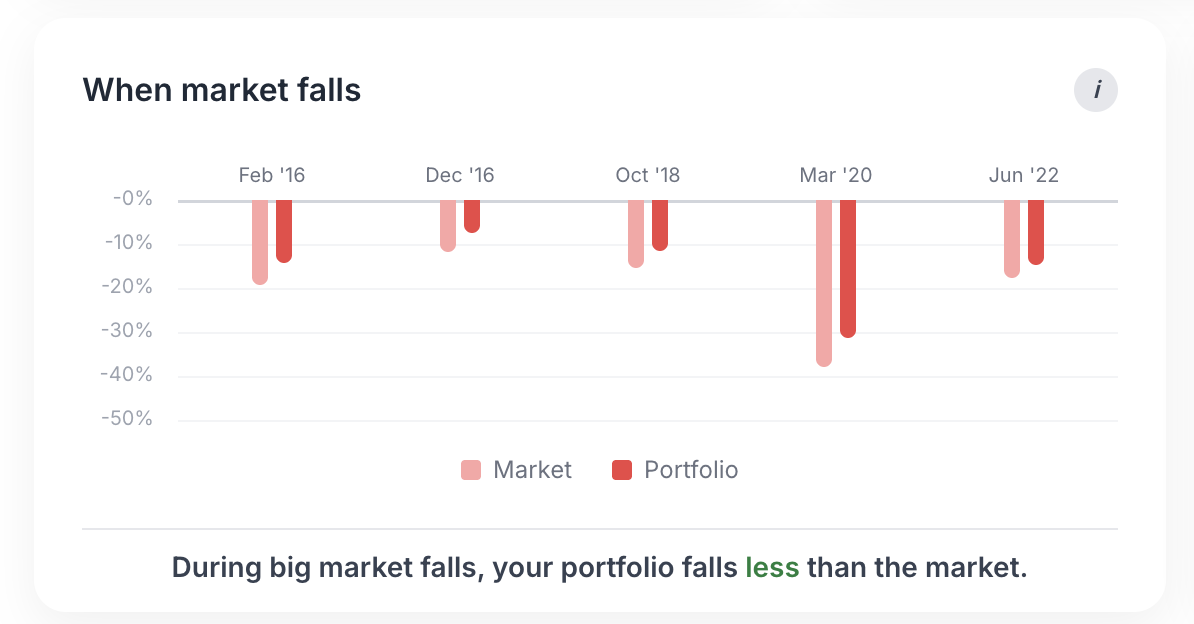
Every portfolio falls in a downturn. The question is whether yours falls more than the market or less, and whether you are actually prepared for that number.
A portfolio with 65% mid and small cap exposure fell roughly 35 to 40% in the recent correction. A portfolio with 60% large cap fell closer to 18 to 22%. Same market, very different experience.
Here is the more personal version of that question: if your portfolio dropped 35% in a single year, would you stay invested? Or would you panic and exit?
Most people overestimate their risk tolerance until they see a large negative number against their name. Understanding how your portfolio has historically behaved in bad periods is emotional preparation. Investors who are prepared are the ones who do not make the most expensive mistake in investing, which is selling at the bottom.
What to look for: In the worst market periods historically, did your portfolio fall more or less than the benchmark? And honestly, are you comfortable with that number?
3. After a Crash, Does It Recover Faster or Slower?
Two portfolios can fall the same amount. But if one takes twice as long to recover, you spend twice as long waiting for your money to come back.
A portfolio that recovers in 10 months versus one that takes 20 means more time underwater, more emotional pressure, and a longer wait before compounding resumes. Time spent recovering is time not spent growing.
The frame is relative: does your portfolio historically recover faster or slower than the benchmark after market falls?
A real example from Dr Fin: A Quant-heavy portfolio showed 7% excess returns over the market on paper. But in bad periods it fell to -35%, frequently underperformed even fixed deposits across multi-year windows, and took on average 50% longer to recover than the benchmark. The headline return looked strong. The full picture was very different.
What to look for: How long has this portfolio historically taken to recover after market falls, compared to benchmark recovery time?

4. Is the Risk Actually Worth the Return?
More risk does not guarantee more return. It only guarantees more volatility.
Think of it this way. Fund A and Fund B have both returned 15% annually over 7 years. But Fund A fell 38% in its worst year while Fund B fell 22%. Fund A is not the better fund. It is the same outcome for significantly more pain.
This plays out at the portfolio level too. Mid cap-heavy portfolios sometimes deliver similar long-term returns to a simpler flexicap or large cap combination, but with sharper drawdowns. Small cap-heavy portfolios can show years of extreme volatility without consistently outperforming the market over a full cycle.
A well-built portfolio is one where the extra return over benchmark is proportionate to the extra downside it carries. When it is not, that is worth fixing.
What to look for: Is the excess return over benchmark proportionate to the extra downside your portfolio carries compared to a simpler alternative?

5. Is Your Asset Allocation Actually Right for Your Horizon?
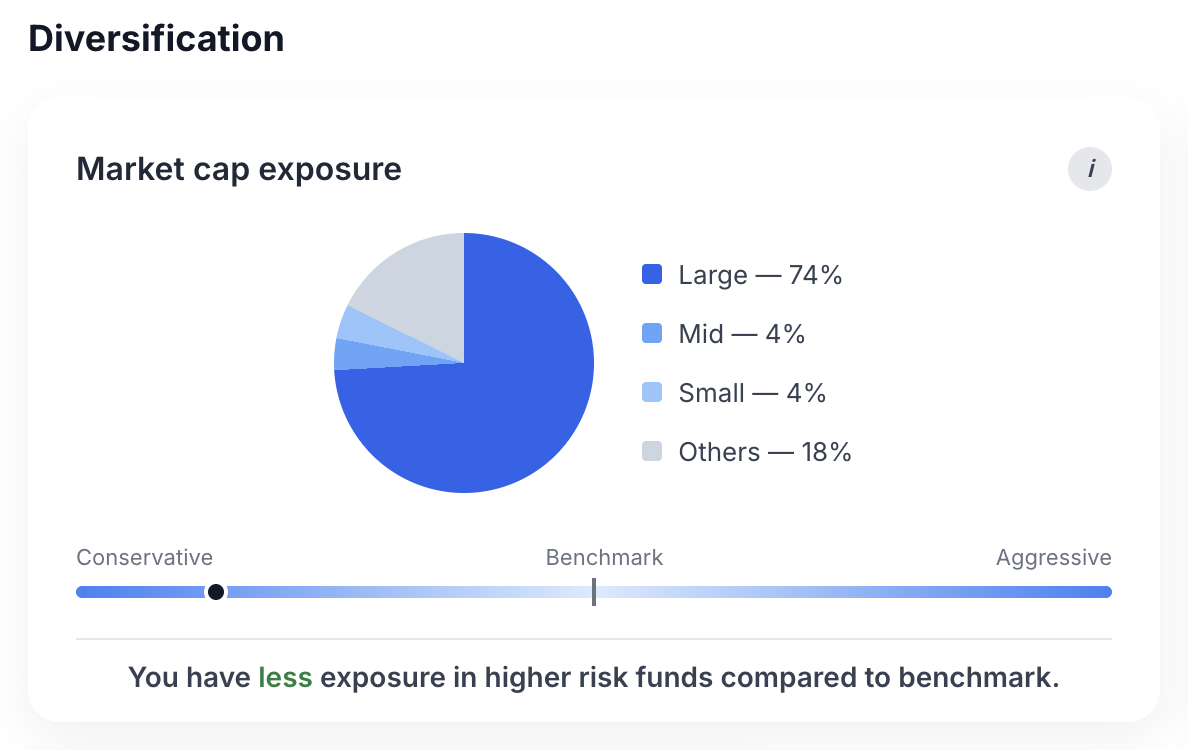
Most investors do not know their actual large, mid, small cap split. If you have not mapped it consciously, there is a good chance your portfolio is more aggressive than you think.
Asset allocation means your actual split across all your funds combined. Not what you intended. What you actually have when you add up every fund's underlying exposure.
| Segment | In a Bull Market | In a Sharp Correction |
|---|---|---|
| Large Cap | Steady, moderate gains | Falls less, recovers faster |
| Mid Cap | Strong gains | Falls more, recovers moderately |
| Small Cap | Highest gains | Falls hardest, slowest recovery |
A common scenario: an investor holds a flexicap fund, a midcap fund, and a smallcap fund, thinking they are spread across categories. But their actual large, mid, small split comes out to 30, 35, 35. A portfolio does not become moderate just because the fund names sound diversified.
Your allocation should be a conscious decision based on your investment horizon and honest risk tolerance, not an accident of which funds you happened to pick. Most investors, if they actually mapped their portfolio, would find they are more aggressive than they realised.
What to look for: What is your actual large, mid, small cap split across all funds? Does it match your horizon and your honest comfort with a potential 35 to 40% fall?
6. Do Your Funds Actually Own Different Things?
Owning 5 funds is not the same as being diversified. If they own the same stocks underneath, you are concentrated, not covered.
This is one of the most common silent problems in Indian retail portfolios. Funds within similar categories naturally gravitate toward the same stocks. Two flexicap funds will overlap heavily on large cap names. A flexicap and a large cap fund will share even more. Add a multicap fund and the overlap compounds further.
An investor holding Parag Parikh Flexi Cap, Mirae Asset Large Cap, and HDFC Flexi Cap may feel well diversified across three fund houses. But the underlying stock overlap across those three funds can be significant. When markets fall, they fall together.
Five funds with heavy overlap are, in practice, one concentrated position with five fee structures.
What to look for: Do your funds have significant stock-level overlap? Is each fund genuinely doing a different job?
7. How Many Funds Is Too Many?
More than 6 or 7 funds rarely makes a portfolio better. It usually just makes it harder to manage.
More funds means more category duplication and overlap that makes diversification feel real but is not. A portfolio with 10 funds is not 2x more diversified than one with 5. It is usually just more complicated, harder to track, and more likely to be doing the same thing multiple times over.
Can you say clearly what job each fund in your portfolio is doing? If two funds are doing the same job, you probably only need one.
8. Are Your Individual Funds Actually Good?
A portfolio can look fine overall while quietly carrying weak funds inside it. The size of the allocation matters as much as the quality.
Fund quality should be evaluated relative to category peers. The right question is: across different market conditions, is this fund consistently in the better half of its category on risk-adjusted returns?
A weak fund with a small allocation may not matter much. A weak fund holding 30 to 35% of your portfolio is a real drag even if everything else holds up.
A real example: In one portfolio reviewed on Dr Fin, a fund rated Bad held 33% of the total allocation. The overall portfolio was still strong because the other three funds were rated Strong. But replacing that one fund is a clear improvement sitting there, same structure, likely better risk-adjusted outcome.
What to look for: Are your funds consistently in the better half of their category on risk-adjusted returns, across different market conditions, not just recent ones?
What a Portfolio Review Does NOT Mean
This is worth saying clearly because it is a common misreading.
Reviewing does not mean changing funds constantly. A review might conclude your portfolio is fine as is. That is a valid and frequent outcome.
Reviewing does not mean reacting to short-term underperformance. If a fund has had a bad 6 months, that is not a reason to exit. It is a reason to understand why, and whether the quality has actually changed.
Reviewing does not mean chasing whatever performed best recently. That is the opposite of what a review should produce. The goal is to understand what you own, not to rotate toward whatever looks good today.
A review is a diagnostic, not a trigger for action. Sometimes the action is to do nothing.
The Most Common Mistakes in Portfolio Reviews
Judging funds by recent returns. A fund that returned 38% in a bull year was likely just in the right segment at the right time. Evaluate on rolling multi-year performance vs category peers.
Assuming more funds means more safety. Overlap means five funds can behave like one concentrated position.
Not knowing your actual asset allocation. Most investors have a vague sense of their portfolio. Few have mapped their actual large, mid, small cap split across all funds combined.
Ignoring downside behavior until it happens. Understanding your portfolio's worst-period behavior before the next correction is what separates calm investors from reactive ones.
Exiting funds after short underperformance. Switching funds after 6 to 12 months of underperformance is one of the most reliably return-reducing behaviors in retail investing. Evaluate quality over rolling 3 year periods minimum.
How Dr Fin Reviews a Portfolio
Most investors know their returns. Very few know how their portfolio actually behaves in bad markets, whether the risk they are taking is proportionate to the return, or whether their funds genuinely diversify each other.
Dr Fin applies this framework systematically to your actual portfolio. Upload your holdings and the analysis covers:
- Excess return vs benchmark across rolling periods
- Downside behavior vs market in bad periods
- Recovery profile vs benchmark
- Risk-return efficiency
- Actual asset allocation with risk interpretation
- Overlap and complexity check
- Fund quality flags with allocation context
The output is a structured diagnostic. Not a recommendations list. Not a top funds ranking. A clear picture of what you actually own, so you can make better decisions about it.
Review your portfolio on Dr Fin →
Closing Thought
A good portfolio is not the one with the highest recent return. It is the one whose behavior you understand, whose risks you are prepared for, and whose structure matches your actual goals. Most investors have never seen that picture clearly. This review framework is how you get there.