
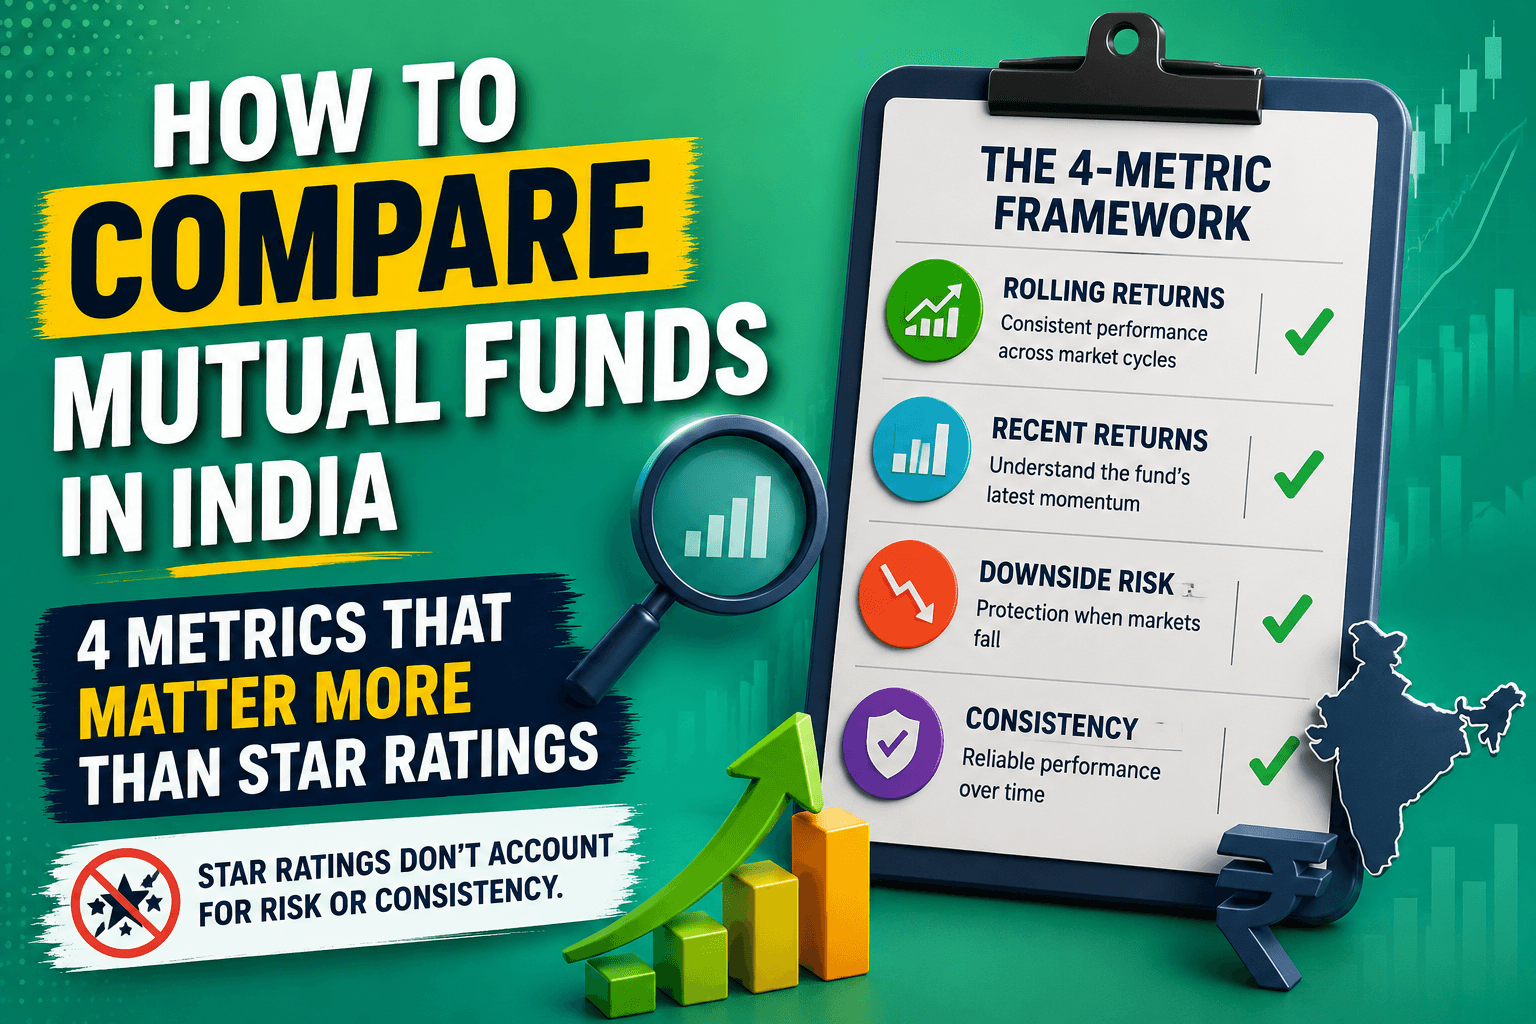
TL;DR
Star ratings don't account for risk or consistency — the two things that actually determine whether a fund is worth holding. The right way to evaluate a mutual fund is to compare it against its benchmark and peers on four specific metrics:
- Rolling Returns — consistent outperformance across your investment horizon, not cherry-picked snapshots
- Recent Returns — does recent performance confirm or contradict the long-term picture?
- Risk: % Chance of Returns Below FD — how often does this fund make you worse off than an FD?
- Consistency — is the fund reliably on top of its category, or does it depend on a few good years?
A fund that consistently fails on most of these metrics deserves closer scrutiny. In many cases, a low-cost index fund may be a better alternative.
Mutual Fund Evaluation Checklist
Before investing in any mutual fund, verify:
- Rolling returns (for your horizon) are above benchmark and category peers
- Risk (% below FD) is at or below the benchmark and peers
- Consistency is rated Good
- Recent returns are consistent with rolling returns (no major divergence)
If a fund fails two or more of these, an index fund in the same category is likely a better choice.
Why Star Ratings Don't Work for Mutual Fund Evaluation
When you search for a mutual fund review, you get one of two things: a star rating with no explanation, or a wall of numbers with no clear conclusion.
Star ratings focus on recent returns — and nothing else. They don't account for the risk taken to generate those returns, and they don't tell you whether the performance is consistent or driven by a lucky year. A fund that returned 18% by taking massive risk may be rated higher than a fund that returned 16% with half the risk — even though the second fund is a better investment for most people.
The only comparison that means anything is fund vs benchmark vs peers — on both returns and risk, side by side. That's what a peer performance analysis does. And it's exactly what DrFin shows you on every fund detail page.
The 4 Metrics That Actually Matter for Mutual Fund Analysis
1. Rolling Returns
Rolling returns measure the average annual return over every possible period of a fixed length in the fund's history — not just one specific start and end date. The period should match your investment horizon: use 3-year rolling if you're investing for 3 years, 5-year rolling for 5 years, and so on.
Why this beats CAGR: Point-to-point CAGR is easy to cherry-pick. A fund that crashed in 2020 and recovered in 2021 can show a great "3-year return" depending on when you measure. Rolling returns smooth all of that out and show how the fund performs on average, across different market entry points.
What to check: Is the fund's rolling return above its benchmark and category peers? If not, you're paying active fund fees for average-or-worse performance.
Quick interpretation:
Good: Better or close to other funds and index
Average: Average compared to other funds and index
Bad: Lower than other funds and index
2. Recent Returns
The most recent point-to-point return for your horizon. Compared alongside rolling returns, it tells you whether recent performance is consistent with the fund's long-term track record — or whether something has changed.
What to check: If recent returns diverge significantly from rolling returns, something shifted. The fund manager may have changed, the strategy may have drifted, or the category may have tailwinds that won't last.
Quick interpretation:
Good: Better or close to other funds and index
Average: Lower than other funds and index
Bad: Much lower than other funds and index
3. Risk — % Chance of Returns Below FD
This is the percentage of historical rolling periods where the fund gave you less than what a fixed deposit would have paid. DrFin calculates this using historical rolling periods since 2015, measuring how often the fund failed to beat a 7% FD-equivalent return.
It answers a practical question: how often does this fund actually make you worse off than just leaving money in an FD?
This is not volatility. Volatility measures how much a fund moves. This metric measures how often that movement results in returns that don't even justify taking equity risk at all.
What to check: Compare this against the benchmark and category peers. If the fund's risk score is significantly higher than both, it's carrying more downside exposure without necessarily delivering better returns.
Quick interpretation:
Good: Better or close to other funds in avoiding low returns
Average: Lower than other funds in avoiding low returns
Bad: Much lower than other funds in avoiding low returns
4. Consistency
Consistency measures whether the fund stays on top of its category across different market conditions — bull runs, corrections, sideways markets — or whether its long-term numbers are driven by a few exceptional years.
Rated: Bad / Average / Good
Why it matters: A fund with Good consistency has a repeatable investment process. A fund with Bad consistency might show strong long-term numbers, but those numbers could be masking long stretches of underperformance punctuated by a single great run. That's luck, not skill — and luck doesn't repeat.
Quick interpretation:
Good: Consistently outperforms — rarely underperforms compared to peers
Average: Sometimes outperforms, sometimes underperforms compared to peers
Bad: Mostly underperforms compared to peers
How Do You Compare Mutual Funds Using a Peer Table?
A peer comparison table puts your fund, its top peers, the benchmark, and the category average side by side — on all four metrics at once.
| Metric | Good Fund | Fund to Avoid |
|---|---|---|
| Rolling Returns | Good vs benchmark and peers | Bad vs benchmark and peers |
| Recent Returns | Consistent with rolling | Sharp divergence from rolling |
| Risk (% Below FD) | Good vs benchmark and peers | Bad vs benchmark and peers |
| Consistency | Good | Bad |
A fund that matches the benchmark on returns but takes more risk is a worse fund — not an equivalent one. A fund that consistently underperforms is a closet indexer: you're paying active management fees for average returns. You'd be better off in an actual index fund at a fraction of the expense ratio.
DrFin shows you this table for every fund — your fund vs top peers vs benchmark vs category average — with all four numbers pre-calculated.
- Compare any two funds head to head →
- See how Parag Parikh Flexi Cap compares to peers →
- See how Motilal Midcap compares to peers →
Should I Choose an Index Fund or an Active Mutual Fund?
This is one of the most searched mutual fund questions in India — and the peer comparison framework answers it directly.
Choose an active fund if:
- Its rolling returns are consistently Good vs benchmark and peers
- Its risk score is Good vs benchmark and peers
- It shows Good consistency
Choose an index fund if:
- The active fund's rolling returns are Average or Bad vs peers
- The active fund's risk score is worse than the benchmark and peers
- Consistency is Average or Bad
If an active fund can't stay on top of its category across different market conditions, there's no reason to pay the higher expense ratio. An index fund will do better — with lower costs and lower complexity.
How Do I Know if a Mutual Fund Is Beating Its Benchmark?
Compare the fund's rolling returns against the benchmark and category peers on a peer table. DrFin shows you this comparison pre-calculated — check any fund here →.
If the fund scores Good on rolling returns and Good on risk, it's genuinely adding value. If rolling returns look good but the risk score is bad, it's not adding value — it's just taking more risk to generate those returns.
Are Star Ratings Enough to Select a Mutual Fund?
No. Star ratings focus only on recent returns and miss the two things that matter most: risk and consistency.
A fund can be rated 5 stars for delivering high returns while taking on significantly more risk than its peers. The same fund might score poorly on consistency — meaning those returns came from a few lucky years, not a repeatable process. Star ratings won't tell you any of this.
Rolling returns, downside risk, and consistency give you a more complete and stable picture.
What Is a Good Rolling Return for a Mutual Fund in India?
The question isn't what the absolute number is — it's whether the fund's rolling return is Good relative to its benchmark and category peers. The comparison matters more than the absolute number.
For reference, Nifty 500 has historically delivered rolling 3Y returns in the range of 12–15% over long periods. A good large cap active fund should consistently beat this after fees. A good mid or small cap fund should beat the Nifty Midcap 150 or Nifty Smallcap 250 benchmarks respectively.
Why Can a Mutual Fund Have High Returns But Still Be a Bad Fund?
Because returns without context are meaningless.
A fund that returned 20% in a year when the benchmark returned 22% underperformed — despite the strong absolute number. A fund that returned 15% while taking twice the risk of its peers is a worse deal than an index fund that returned 14% at standard risk.
High absolute returns can come from a concentrated bet that happened to pay off, a bull market that lifted all funds in the category, or excess risk that hasn't caused pain yet — but will. Rolling returns, downside risk, and consistency separate genuine skill from temporary luck. That's the core of how DrFin analyses every fund.
See It in Action — 1 Minute Fund Review
The fastest way to learn this framework is to watch it applied to real funds.
Every episode of the 1 Minute Fund Review series on DrFin walks through one mutual fund using these four metrics, and ends with a tier verdict (S / A / B / C).
Ep 1: Kotak Mahindra Flexi Cap Fund — Closet Index Fund?
More episodes coming every week. Or go straight to any fund:
The Bottom Line
Evaluating a mutual fund doesn't require a finance degree. It requires four numbers, a peer comparison table, and knowing what to compare against.
Rolling returns. Recent returns. Risk of FD underperformance. Consistency.
Compare every fund against its benchmark and peers on these four metrics — and you'll make better fund decisions than most investors who rely on star ratings alone.